Se rendre au contenu
Odoo Menu
  • Se connecter
  • Essai gratuit
  • Applications
    Finance
    • Comptabilité
    • Facturation
    • Notes de frais
    • Feuilles de calcul (BI)
    • Documents
    • Signature
    Ventes
    • CRM
    • Ventes
    • PdV Boutique
    • PdV Restaurant
    • Abonnements
    • Location
    Sites web
    • Site Web
    • eCommerce
    • Blog
    • Forum
    • Live Chat
    • eLearning
    Chaîne d'approvisionnement
    • Inventaire
    • Fabrication
    • PLM
    • Achats
    • Maintenance
    • Qualité
    Ressources Humaines
    • Employés
    • Recrutement
    • Congés
    • Évaluations
    • Recommandations
    • Parc automobile
    Marketing
    • Marketing Social
    • E-mail Marketing
    • SMS Marketing
    • Événements
    • Marketing Automation
    • Sondages
    Services
    • Projet
    • Feuilles de temps
    • Services sur Site
    • Assistance
    • Planification
    • Rendez-vous
    Productivité
    • Discussion
    • Intelligence artificielle
    • Internet des Objets
    • VoIP
    • Connaissances
    • WhatsApp
    Applications tierces Odoo Studio Plateforme Cloud d'Odoo
  • Industries
    Commerce de détail
    • Librairie
    • Magasin de vêtements
    • Magasin de meubles
    • Supermarché
    • Quincaillerie
    • Magasin de jouets
    Restauration & Hôtellerie
    • Bar et Pub
    • Restaurant
    • Fast-food
    • Maison d’hôtes
    • Distributeur de boissons
    • Hôtel
    Immobilier
    • Agence immobilière
    • Cabinet d'architecture
    • Construction
    • Gestion immobilière
    • Jardinage
    • Association de copropriétaires
    Consultance
    • Cabinet d'expertise comptable
    • Partenaire Odoo
    • Agence Marketing
    • Cabinet d'avocats
    • Aquisition de talents
    • Audit & Certification
    Fabrication
    • Textile
    • Métal
    • Meubles
    • Alimentation
    • Brasserie
    • Cadeaux d'entreprise
    Santé & Fitness
    • Club de sports
    • Opticien
    • Salle de fitness
    • Praticiens bien-être
    • Pharmacie
    • Salon de coiffure
    Commerce
    • Homme à tout faire
    • Matériel informatique & support
    • Systèmes photovoltaïques
    • Cordonnier
    • Services de nettoyage
    • Services CVC
    Autres
    • Organisation à but non lucratif
    • Agence environnementale
    • Location de panneaux d'affichage
    • Photographie
    • Leasing de vélos
    • Revendeur de logiciel
    Parcourir toutes les industries
  • Communauté
    Apprenez
    • Tutoriels
    • Documentation
    • Certifications
    • Formation
    • Blog
    • Podcast
    Renforcer l'éducation
    • Programme éducatif
    • Business Game Scale-Up!
    • Rendez-nous visite
    Obtenir le logiciel
    • Téléchargement
    • Comparez les éditions
    • Versions
    Collaborer
    • Github
    • Forum
    • Événements
    • Traductions
    • Devenir partenaire
    • Services pour partenaires
    • Enregistrer votre cabinet comptable
    Nos Services
    • Trouver un partenaire
    • Trouver un comptable
    • Rencontrer un conseiller
    • Services de mise en œuvre
    • Références clients
    • Assistance
    • Mises à niveau
    Github Youtube Twitter Linkedin Instagram Facebook Spotify
    +1 (650) 691-3277
    Obtenir une démonstration
  • Tarification
  • Aide
Vous devez être inscrit pour interagir avec la communauté.
Toutes les publications Personnes Badges
Étiquettes (Voir toutl)
odoo accounting v14 pos v15
À propos de ce forum
Vous devez être inscrit pour interagir avec la communauté.
Toutes les publications Personnes Badges
Étiquettes (Voir toutl)
odoo accounting v14 pos v15
À propos de ce forum
Aide

How to Build Custom Forecasted Quantity Reports in Odoo

S'inscrire

Recevez une notification lorsqu'il y a de l'activité sur ce poste

Cette question a été signalée
inventoryreportforecastquickstartQuickstart
2 Réponses
3694 Vues
Avatar
Abraham Ismael Torales Salazar (aits)

Use case: 

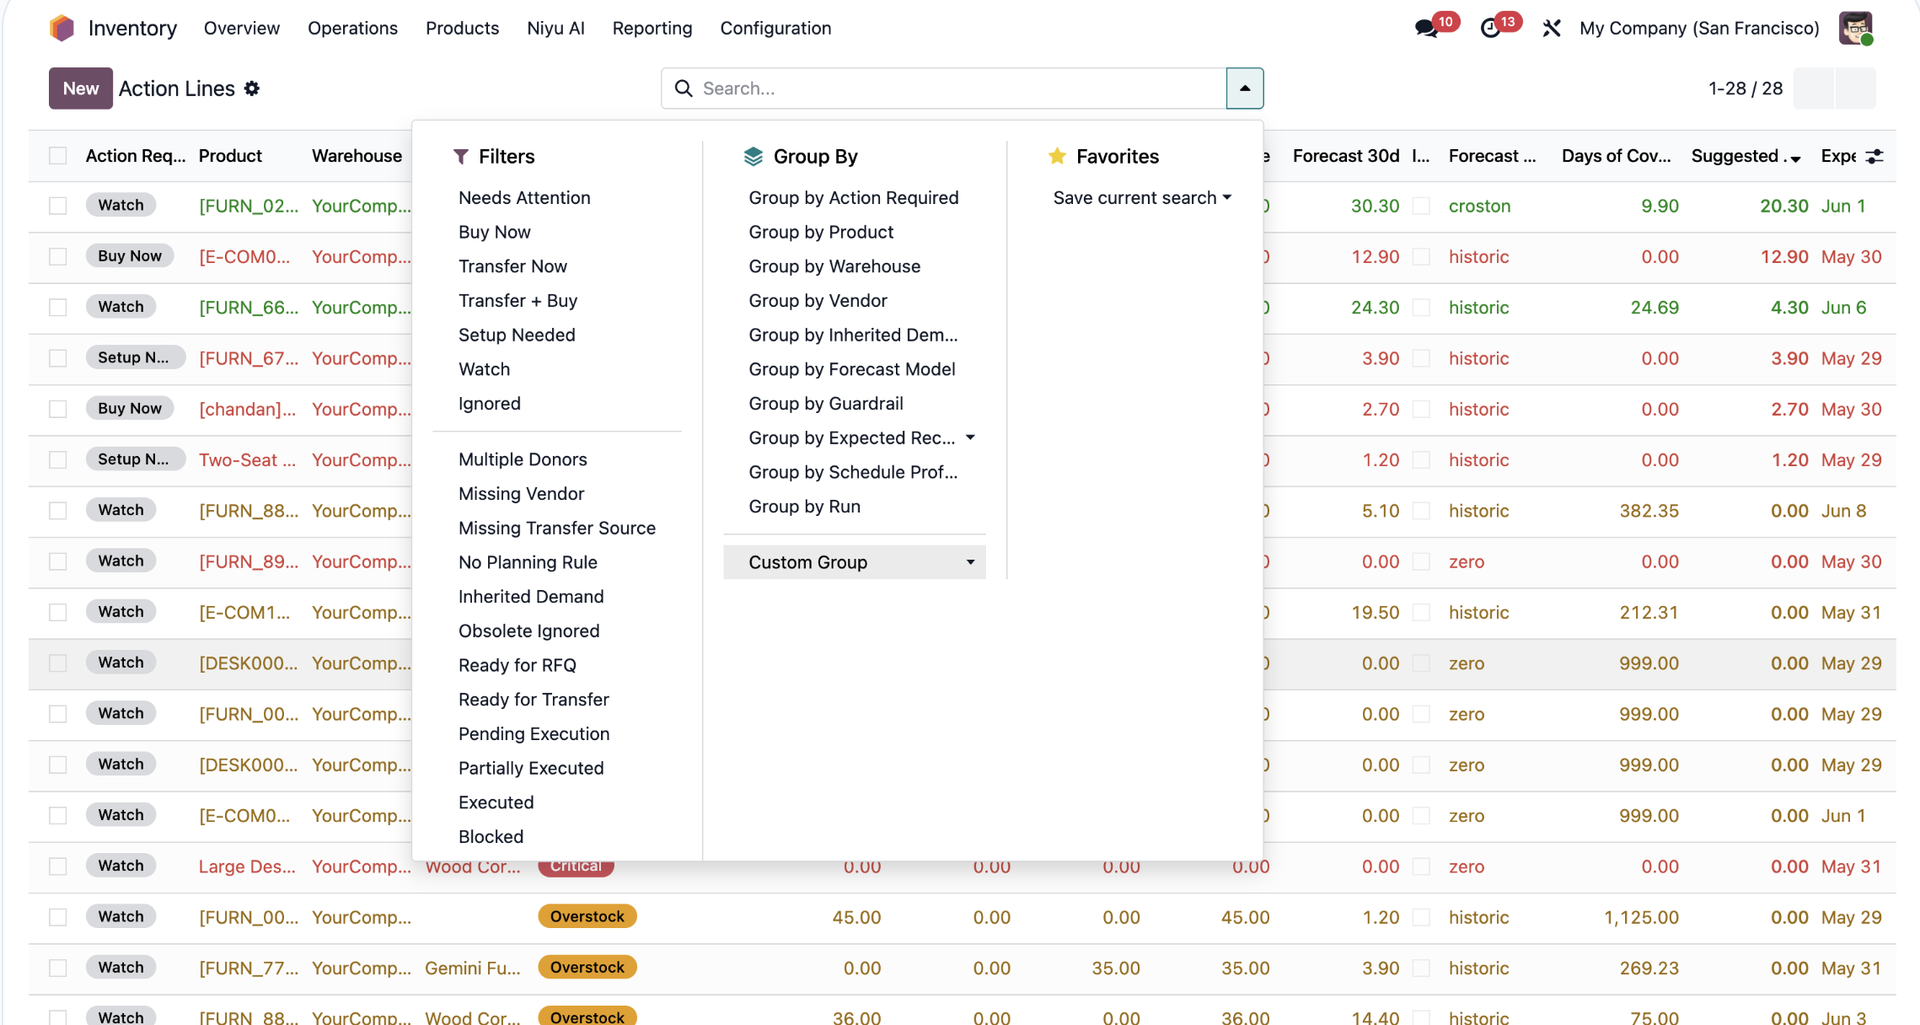
Being able to filter the forecasted inventory quantities by product category, customer, different locations, warehouses etc. or being able to see many products forecasted quantities at once.


Versions: 

This was proven in V18, but the same logic would apply to earlier versions.

2
Avatar
Ignorer
Avatar
Abraham Ismael Torales Salazar (aits)
Auteur Meilleure réponse

Option 1


Step 1: Go to Inventory app, open Studio, and add a menu for report.stock.quantity model

Tip: From this page, you could also move the report menu inside any other menu.


Step 2: Inside the new menu page, set the next filter as favorite/default filter

Tip: In case you need it, you can also filter by forecasted receipts or deliveries


Now you can filter/group your report based on different parameters that belong to product template, product variant, date, company and/or warehouse


Example: Report for Product Category Furtniture/Office between September 1 and 30 in the Warehouse "YourCompany"


Tip: Using Studio, you could also add a pivot table view 


Example: Pivot table showing forecasted quantity in products in the category "Furtniture/Office" grouped by month and warehouse


Option 2

Step 1: Add the following models to Spreadhsheets using the action button from the list view

Make sure to add the appropiate filters before inserting the list in Spreadsheet


Models to insert in spreadsheets:

Model

Technical Model Name

Filters

Locations

stock.quant

"Internal Locations"

"In Stock"

Moves Analysis

stock.move

"Incoming"

Status is not in "Done" or "Cancelled"

Moves Analysis

stock.move

"Outgoing"

Status is not in "Done" or "Cancelled"


💡

Make sure to add as many rows (for each table) as you think you will need, depending on the volume of your operations.

​

You can change the name of the sheets and the lists to easier identify each table and manage the Spreadhsheets formulas.


Example:


Step 2: Add a new sheet and manually create a table with the following columns 

  1. Date
  2. All Dates
  3. Pending Incoming
  4. Pending Outgoing
  5. Current Stock
  6. Accumulated Incoming
  7. Accumulated Outgoing
  8. Forecast


Use other 2 cells in the same sheet to stablish the Minimun Date and Maximun Date with the following formulas:


Cell

Formula

Explanation

Min Date

=ROUNDDOWN(

MIN(

FILTER('Incoming quantities'!A:A, 'Incoming quantities'!A:A>0),

FILTER('Outgoing quantities'!A:A, 'Outgoing quantities'!A:A>0), TODAY()

),0

)

Retrieves the minimum date value between the incoming and outgoing quantities table (the Date in both tables is stored in column A) and today.


This formula is ignoring the empty cells by applying the filter > 0, and rounding down to ignore the hours/minutes/seconds


This is based on field "date" in "Moves Analysis" model

Max Date

=ROUNDDOWN(

MAX(

FILTER('Incoming quantities'!A:A, 'Incoming quantities'!A:A>0),

FILTER('Outgoing quantities'!A:A, 'Outgoing quantities'!A:A>0)

),0

) + 10

Retrieves the maximum date value between the incoming and outgoing quantities table (the Date in both tables is stored in column A) and today.


This formula is ignoring the empty cells by applying the filter > 0, and rounding down to ignore the hours/minutes/seconds


The formula is adding 10 days more just to have a better looking graph


This is based on field "date" in "Moves Analysis" model


✅

Remember to format these cells as date

​


💡

If, for any reason, both tables (incoming and outgoing quantities) are empty, it will display value equal to zero, which is equal to Dec 30 1899. We will fix that later.

​

For the table generated in Step 2, add the following formulas and drag them down:


A

B

C

D

E

F

G

H

I

J

K

1

Date

All Dates

Pending Incoming

Pending Outgoing

Current Stock

Accumulated Incoming

Accumulated Outgoing

Forecast


2

=K2

=IF(K2=0,TODAY(),K2)

=SUMIFS('Incoming quantities'!F:F,ROUNDDOWN('Incoming quantities'!A:A),A2)

=SUMIFS('Outgoing quantities'!F:F,ROUNDDOWN('Outgoing quantities'!A:A),A2)

=SUM('Quantities in Stock'!D:D)

=C2

=D2

=IF(A2="","",$E$2+F2-G2)


Minimum Date

(Formula mentioned above)

3

=IF(B3>$K$3,"",B3)

=B2+1

Drag the previous formula down from here

Drag the previous formula down from here

Don't drag formula down

=F2+C3

=G2+D3

Drag the previous formula down from here


Maximum Date

Formula mentioned above)

4

Drag the previous formula down from here

Drag the previous formula down from here


Drag the previous formula down from here

Drag the previous formula down from here


Brief explanation:

  • K2 and K3 in the same sheet are the minimun and maximum dates respectively in my spreadsheet
  • Sheet "Incoming quantities" (list from Move Analysis model):
    • Column A: Dates for each pending receipt in Odoo. Rounding down the dates to ignore the hours/minutes/seconds
      • Field name: "date"
    • Column F: "Demand" quantities for each pending receipt in Odoo
      • Field name: "product_uom_qty"
  • Sheet "Outgoing quantities" (list from Move Analysis model):
    • Column A: Dates for each pending delivery in Odoo. Rounding down the dates to ignore the hours/minutes/seconds
      • Field name: "date"
    • Column F: "Demand" quantities for each pending delivery in Odoo
      • Field name: "product_uom_qty"
  • Sheet "Quantities in Stock" (list from Location Report model):
    • Column D: Inventoried Quantity
      • Field name "inventory_quantity_auto_apply"


Step 3: Add a graph to show the forecast based on date 


Step 4: Add global filters to filter the data you would like to see


Example of filters by location, product categories, and specific product.

Note: For locations, I stablished only one filter as "Intermediate location" for receipts and as "Source location" for deliveries, but you can create two independent filters to have more control over the location filter for receipts and deliveries. You can set one or more locations per filter at the same time, so you can see a report of one or more warehouses


💡

These are "Relation" filters; you can create anyone you want to filter any relational field that exists in the models we linked to the spreadsheets (Locations Report and Move Analysis), you just have to select the field in each table that is linked to the model selected for the filter. 

​

Final result: 


Explanation:

  • I currently have 100 units in my warehouse
  • I will deliver 20 units on Sept 15  Then I will have 80 forecasted units
  • I will receive 10 units on Sep 22  Then I will have 90 forecasted units
  • I will receive 50 units on Oct 01  Then I will have 140 forecasted units


Aditional: Add conditional formating 

In order to identify easier:

  • Today's date in column A and B
  • Any pending recepits/deliveries in column C and D
  • Current Stock in E2
  • The dates when the forecasted quantities are less than or equal to 0


✅

Remember to add as many rows as needed to show all the days between the minimum date and maximum date

​

4
Avatar
Ignorer
Avatar
Rishu, Niyu Labs
Meilleure réponse
Hi,

For this report, the key is to decide whether you need a snapshot report or a live operational report.

A useful forecasted quantity report should usually allow filters by:

- product / product category
- warehouse / location
- customer or demand source
- incoming purchase orders
- outgoing sales/manufacturing demand
- date horizon

The tricky part is that Odoo forecasted quantity is not just one stored number. It depends on stock moves, reservations, incoming receipts, outgoing demand, manufacturing, and the date window. So I would avoid copying only `qty_available` or building a simple product table.

A good first version would be:
- product
- on hand
- outgoing demand
- incoming quantity
- forecasted quantity
- shortage / surplus
- grouped by warehouse and category

We build Odoo inventory planning and reporting workflows at Niyu Labs. If useful, I can share the minimum fields I’d include so the report is operational and not just another spreadsheet.


0
Avatar
Ignorer
Vous appréciez la discussion ? Ne vous contentez pas de lire, rejoignez-nous !

Créez un compte dès aujourd'hui pour profiter de fonctionnalités exclusives et échanger avec notre formidable communauté !

S'inscrire
Publications associées Réponses Vues Activité
How to use valued delivery notes Résolu
accounting inventory quickstart Quickstart
Avatar
1
avr. 26
1051
How to use valued delivery notes
accounting inventory quickstart Quickstart
Avatar
0
avr. 26
7
How can I get a report on the quantity of products I have sold but not yet reserved? Résolu
inventory report quantity forecast
Avatar
Avatar
1
juin 25
2175
¿How can I display the total product quantity from different warehouses in Odoo e-commerce? V 16, 17
inventory ecommerce quickstart Quickstart
Avatar
Avatar
1
juin 24
5510
Change delivery slip printed from the barcode sheet Résolu
inventory report quickstart odoo16features
Avatar
1
sept. 23
3369
Communauté
  • Tutoriels
  • Documentation
  • Forum
Open Source
  • Téléchargement
  • Github
  • Runbot
  • Traductions
Services
  • Hébergement Odoo.sh
  • Assistance
  • Migration
  • Développements personnalisés
  • Éducation
  • Trouver un comptable
  • Trouver un partenaire
  • Devenir partenaire
À propos
  • Notre société
  • Actifs de la marque
  • Contactez-nous
  • Emplois
  • Événements
  • Podcast
  • Blog
  • Clients
  • Informations légales • Confidentialité
  • Sécurité.
الْعَرَبيّة Català 简体中文 繁體中文 (台灣) Čeština Dansk Nederlands English Suomi Français Deutsch हिंदी Bahasa Indonesia Italiano 日本語 한국어 (KR) Lietuvių kalba Język polski Português (BR) română русский язык Slovenský jazyk Slovenščina Español (América Latina) Español Svenska ภาษาไทย Türkçe українська Tiếng Việt

Odoo est une suite d'applications open source couvrant tous les besoins de votre entreprise : CRM, eCommerce, Comptabilité, Inventaire, Point de Vente, Gestion de Projet, etc.

Le positionnement unique d'Odoo est d'être à la fois très facile à utiliser et totalement intégré.

Website made with

Odoo Experience on YouTube

1. Use the live chat to ask your questions.
2. The operator answers within a few minutes.

Live support on Youtube
Watch now